What is Tolerance Stack-Up in Drive Shaft Assemblies?
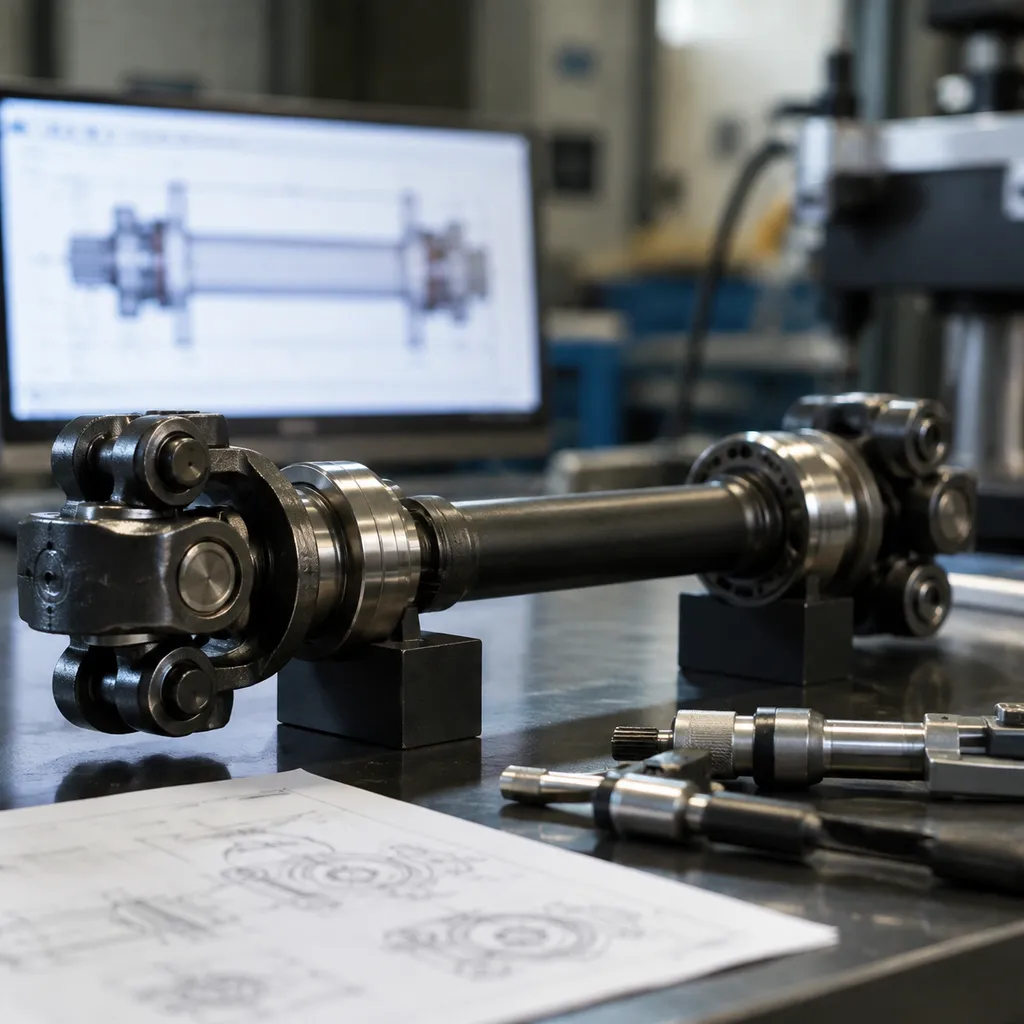
Tolerance stack-up in drive shaft assemblies refers to the cumulative effect of individual manufacturing variations across multiple mating components. In high-performance drivetrain systems, every fabricated part—from the main tube to the splines—contains subtle dimensional variances within permissible tolerances. When these parts assemble into a single rotating drive shaft, individual tolerances combine, leading to total dimensional variation that can compromise system alignment and operational efficiency.
Understanding Tolerance Accumulation
Tolerance accumulation occurs because no manufacturing process produces perfectly identical parts. Through formal dimensional analysis, engineers track how micro-variations add up along the length and rotational axis of the drive shaft.
- Linear Stack-Up: Accumulation along the longitudinal axis, directly affecting overall shaft length and fitment depth.
- Radial Stack-Up: Accumulation across concentric mating surfaces, impacting runout and dynamic balance.
- Angular Stack-Up: Angular deviations at flange or joint faces, causing misalignment across universal joint operating angles.
Key Drive Shaft Components Affected by Stack-Up
A typical drive shaft assembly relies on tight interactions among several critical components. Small variations in any single part propagate across the entire assembly:
| Drive Shaft Component | Stack-Up Impact |
|---|---|
| Slip Yokes & Splines | Dictates plunge depth and engagement length within the transmission or transfer case. |
| Universal / CV Joints | Affects rotational centerlines, dynamic balance, and joint operating angles. |
| Flange Yokes | Determines angular alignment and interface flushness with differential input shafts. |
| Shaft Tubing | Controls wall thickness uniformity, overall assembly length, and high-speed runout. |
Why Tolerance Stack-Up Management Matters
Failing to control tolerance stack-up directly undermines torque transmission quality and mechanical longevity. Uncontrolled accumulation leads to severe operational issues:
- Excessive Drivetrain Vibration: Unintended eccentricities cause severe rotational imbalance, leading to noise, vibration, and harshness (NVH) throughout the vehicle.
- Improper Axial Clearance: Excessive length expansion or contraction can bottom out slip joints, damaging transmission seals or pinion bearings.
- Accelerated Component Wear: Poor shaft alignment increases force on U-joint needle bearings, seals, and supporting shaft bearings, drastically shortening service life.
- Higher Scrap Rates: Identifying tolerance mismatches during final assembly causes costly production delays and rework.
sensitive analysis methods ensure drive shaft assemblies deliver reliable power transfer without inducing mechanical strain. Evaluating tolerance accumulation early prevents poor shaft alignment and dangerous drivetrain vibration.
Worst-Case Analysis
Worst-case analysis assumes every individual component is manufactured at its maximum or minimum material limit simultaneously. This deterministic approach calculates the absolute extreme boundary of dimensional variation.
- Calculation: Sums the maximum tolerance limits of all mating features in the dimensional loop directly.
- Key Advantage: Guarantees 100% part interchangeability with zero risk of assembly interference.
- Main Drawback: Leads to overly tight tolerances on individual components, increasing machining costs.
- Primary Use: Vital for verifying critical axial clearance where mechanical binding under load would cause catastrophic drive shaft failure.
Statistical Analysis (Root Sum Square - RSS)
Statistical analysis relies on the Root Sum Squares (RSS) method, operating on the principle that manufacturing variations follow a normal standard distribution. It assumes parts will rarely hit extreme limits at the same exact time.
- Calculation: Takes the square root of the sum of the squared individual tolerance values.
- Key Advantage: Permits looser individual component tolerances while maintaining high assembly yield, significantly reducing machining expenses.
- Main Drawback: Carries a minor statistical probability (typically less than 0.27%) of non-conforming assemblies.
- Primary Use: Ideal for high-volume drive shaft production lines balancing high precision with manufacturing economy.
Worst-Case vs. RSS Method Comparison
Choosing the right technique depends on safety criticalities, volume targets, and performance demands. Reviewing practical engineering metrics in production case studies helps select the most cost-effective approach for each interface.
| Feature / Metric | Worst-Case Analysis | Statistical Analysis (RSS) |
|---|---|---|
| Tolerance Assumption | Extreme limits occur simultaneously | Normal bell-curve variation around nominal |
| Failure Risk | Absolute zero (100% fit guaranteed) | Low statistical risk (~3-sigma level) |
| Machining Cost | Higher due to tight tolerance requirements | Lower due to relaxed component tolerances |
| Key Benefit | Eliminates severe mechanical binding | Controls rotational imbalance cost-effectively |
| Best Shaft Application | High-load custom driveshafts & safety joints | Mass-produced automotive/industrial shafts |
Step-by-Step Process to Calculate Tolerance Stack-Up
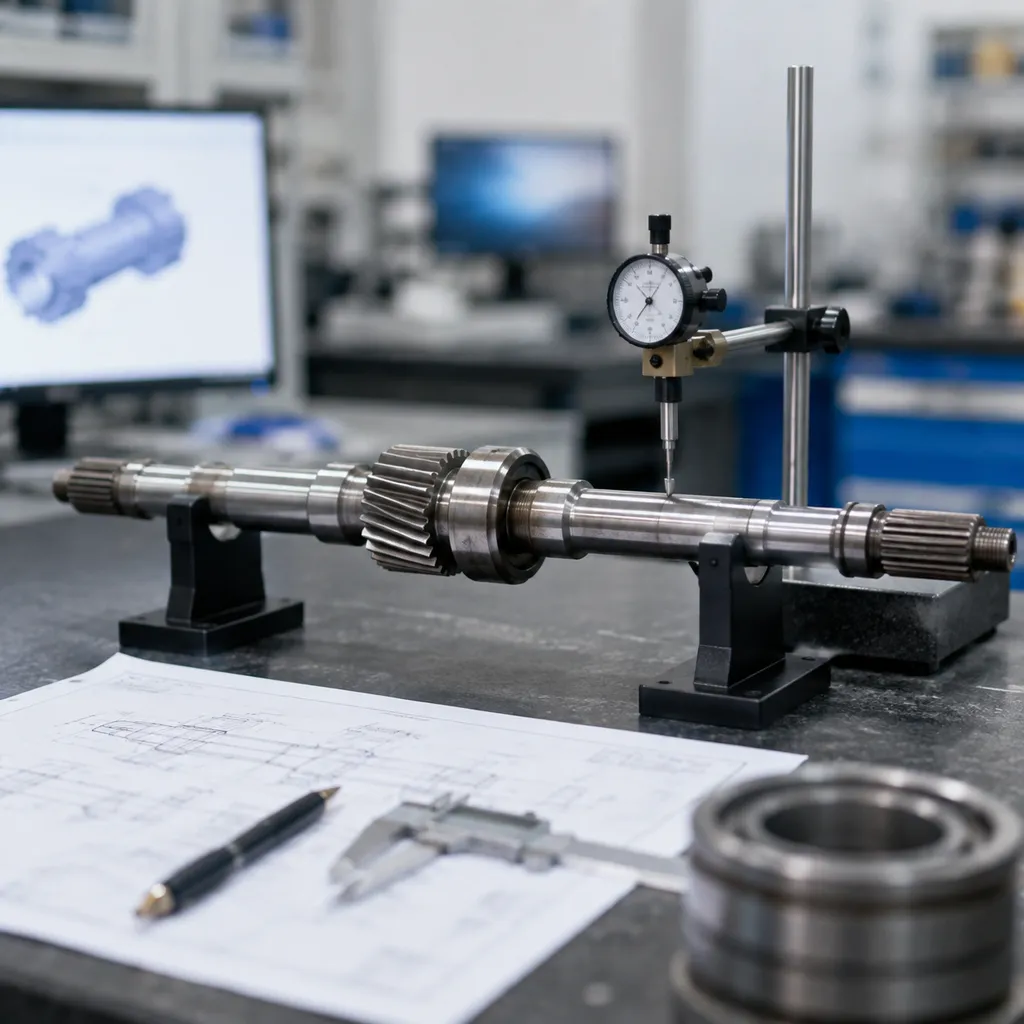
Calculating drive shaft tolerance stack-up requires a structured approach to prevent fitment failures, excessive axial clearance, and severe drivetrain vibration. We use a three-step method to evaluate dimensional variation across drive shaft assemblies accurately.
Step 1: Define the Stack Loop and Mating Features
First, establish a closed dimensional loop that traces the vector path from a fixed reference point to the critical final clearance gap.
- Identify Reference Datums: Select a primary datum, such as the transmission output shaft shoulder.
- Trace the Vector Path: Map every mating component along the axis, including flange yokes, universal joints, slip splines, bearings, and snap rings.
- Assign Vector Directions: Assign positive (+1) or negative (-1) signs to each dimension based on whether increasing the part length widens or narrows the final gap.
Step 2: Determine Individual Component Tolerances
Next, gather the nominal dimensions and tolerance limits for every component in the stack loop using engineering prints and GD&T callouts.
When critical interfaces require extreme precision, managing strict limits—similar to challenges seen in filling nozzle tolerance when 5 micron precision is needed—helps ensure that component-level variation stays within controllable bounds.
| Component Feature | Nominal Dimension (mm) | Tolerance (mm) | Vector Direction |
|---|---|---|---|
| Output Shaft Shoulder | 150.00 | ±0.10 | Positive (+1) |
| Flange Yoke Hub | 210.00 | ±0.15 | Negative (-1) |
| Universal Joint Cross | 85.00 | ±0.05 | Positive (+1) |
| Retaining Ring Groove | 5.00 | ±0.03 | Negative (-1) |
Step 3: Calculate Total Stack-Up Accumulation
ly, combine the component variations to determine the total expected stack-up using both worst-case and statistical methods.
- Worst-Case Stack Formula: Sum the absolute value of all individual tolerances to find the theoretical maximum variation limit:
Worst-Case Tolerance = T1 + T2 + T3 + ... + Tn - Root Sum Squares (RSS) Formula: Calculate the square root of the sum of squared tolerances to model realistic manufacturing distributions:
RSS Tolerance = √(T1² + T2² + T3² + ... + Tn²)
Comparing both results allows us to set safe axial clearance thresholds for the assembly without imposing unnecessarily tight tolerances on non-critical shaft features.
Using GD&T to Prevent Drive Shaft Tolerance Accumulation
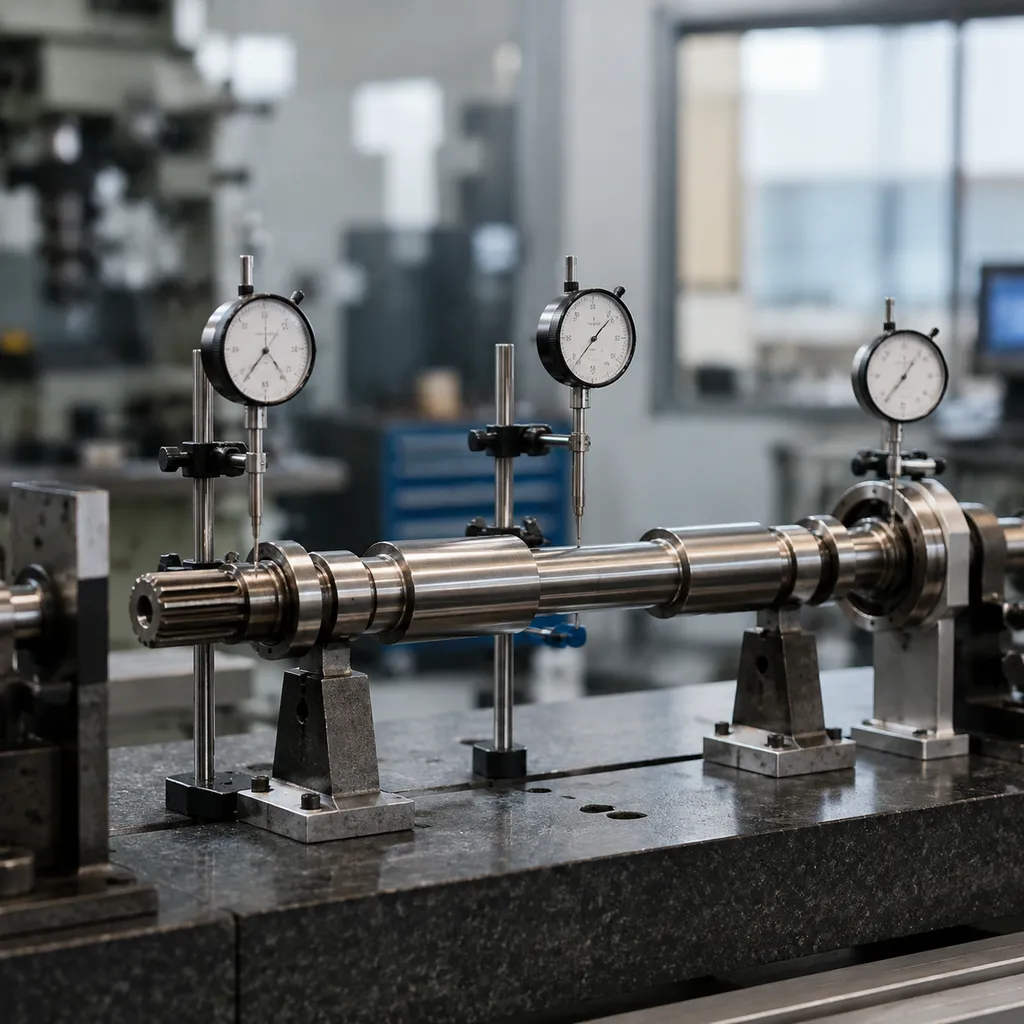
Traditional linear dimensions often fall short when managing the complex geometric relationships of rotating parts. Using geometric dimensioning and tolerancing (GD&T) allows us to control the exact shape, orientation, and position of mating features, effectively stopping tolerance stack-up before parts reach the shop floor.
Establishing Clear Datums for Rotating Components
To prevent rotational imbalance and keep drive shafts spinning true, every critical feature must reference established datum features. Proper datum selection ensures that all machining operations align with the shaft's real-world functional center.
- Primary Axis Datum: Defines the functional centerline of rotation, typically set by the main bearing journals.
- Secondary Axial Datum: Establishes a square face shoulder to prevent angular misalignments during mounting.
When we produce heavy-duty components like hardened conveyor drive shafts, establishing exact datums keeps total axial clearance tight and predictable under heavy torque load changes.
Applying Feature Control Frames
Feature control frames give us precise mathematical boundaries for critical shaft geometries, isolating tolerances so they do not compound across the assembly. We focus primarily on these geometric controls:
- Circular and Total Runout: Controls surface variation relative to the rotational axis to eliminate dynamic drivetrain vibration.
- Concentricity: Ensures the center points of different shaft steps stay aligned along the main axis.
- Perpendicularity: Keeps flange shoulders square to the shaft center to prevent binding on mating couplings.
Comparing Plus/Minus Tolerancing to GD&T
Relying solely on standard plus/minus tolerancing creates square tolerance zones that often result in tight, expensive machining limits or unexpected assembly fit issues. GD&T replaces these with cylindrical tolerance zones that better mirror real-world cylindrical parts.
| Feature | Plus/Minus Tolerancing | Geometric Dimensioning & Tolerancing (GD&T) |
|---|---|---|
| Tolerance Zone Shape | Square / Rectangular | Cylindrical (3D spherical/circular) |
| Usable Area | Restricted corners | Provides up to 57% more functional tolerance area |
| Assembly Alignment | Higher risk of poor shaft alignment | Guarantees clear alignment and interchangeability |
| Manufacturing Cost | Higher due to tight, arbitrary linear limits | Lower by expanding allowable tolerances safely |
Switching to GD&T protects critical fits while giving manufacturing teams maximum flexibility, directly controlling the final stack-up without inflating production costs.
Best Practices for Managing Drive Shaft Tolerance Stack-Up
Managing tolerance stack-up in drive shaft assemblies requires proactive design strategies rather than late-stage fixes. Based on years of precision manufacturing experience, we rely on core principles that keep drivetrain vibration low and long-term durability high.
Minimizing Mating Features and Interfaces
Every physical interface introduces variation. To keep dimensional drift under control, streamline the mechanical chain:
- Combine components: Integrate yokes, splines, or flanges directly into the shaft structure whenever possible.
- Reduce joint counts: Fewer press-fit interfaces mean less cumulative axial clearance and fewer alignment errors.
- Simplify locators: Use direct pilot surfaces rather than multi-piece adapters to maintain precise shaft alignment.
Aligning Designs with Manufacturing Capabilities
Designing impossible tolerances on paper leads to high scrap rates and soaring production costs. We always align our engineering targets directly with real-world shop floor capabilities.
| Manufacturing Process | Typical Precision Range | Stack-Up Impact |
|---|---|---|
| CNC Turning / Milling | ±0.013 mm to ±0.025 mm | Controls primary length and pilot diameters |
| Precision Grinding | ±0.002 mm to ±0.005 mm | Minimizes rotational imbalance at bearing seats |
| Broaching / Splining | ±0.020 mm to ±0.050 mm | Dictates torsional play and slip yoke fit |
Match tight tolerance callouts strictly to critical functional features, while opening up non-critical dimensions to lower unit costs.
Performing Analysis Early in the Design Phase
Calculate stack accumulation before cutting metal. Waiting until physical prototyping leads to expensive re-tooling and project delays.
- Run 1D stacks early: Perform linear calculations during initial component positioning.
- Apply realistic bounds: Use worst-case analysis for safety-critical fits and root sum squares (RSS) methods for high-volume production.
- Validate GD&T callouts: Ensure proper geometric dimensioning and tolerancing standards are applied before releasing drawings to production.
Leveraging Simulation Software for Stack Optimization
Modern 3D tolerance analysis software removes guesswork from complex, multi-axis drive shaft assemblies.
- Automate Monte Carlo simulations: Model thousands of virtual assemblies to predict real-world yield rates accurately.
- Identify key contributors: Instantly spot which component dimensions contribute most to assembly runout.
- Optimize tolerances digitally: Fine-tune component limits on-screen to achieve the ideal balance between performance and machining cost.